Advanced BMI Calculator: Body Fat %, Ethnicity Thresholds & Goal Weight
Free BMI Calculator with estimated body fat %, Asian ethnicity-adjusted thresholds (≥23), Ozempic eligibility check, goal weight calculator & BMI Prime. Accurate results for adults, teens & athletes.
Enter Your Details
Health & Fitness Calculators
Track your health and fitness goals.
📖 How to Use the BMI Calculator
- Enter your weight in kilograms or pounds
- Enter your height in centimetres, metres, or feet and inches
- Optionally open Advanced Metrics: add age, biological sex, ethnicity, and waist circumference for personalised body fat estimate, ethnicity-adjusted thresholds, and WHtR
- Click Calculate BMI to see your result, BMI Prime, body composition, and goal weight tools
✨ Key Features
- ✓BMI calculation with WHO-standard categories (metric and imperial)
- ✓BMI Prime — normalised ratio for easy progress tracking
- ✓Estimated body fat % using the Deurenberg clinical formula (requires age + sex)
- ✓Ethnicity-adjusted BMI interpretation (Asian, Pacific Islander, and standard thresholds)
- ✓Goal BMI Reverse Calculator — enter any target BMI to find your target weight
- ✓Waist-to-Height Ratio (WHtR) — superior predictor of cardiovascular risk
- ✓Ponderal Index — more accurate for very tall or short individuals
- ✓Body Surface Area (BSA) using Mosteller formula — used in clinical drug dosing
- ✓BMI history tracking across up to 5 previous calculations
- ✓All calculations run locally — no data is stored or transmitted
BMI Table for Adults
The following classification system for adults aged 20 and older follows recommendations established by the World Health Organization (WHO). This standardised approach applies uniformly to both men and women, though individual body composition differences mean that clinical interpretation should always accompany the number.
| Classification | BMI Range (kg/m²) | Health Risk |
|---|---|---|
| Severe Thinness | < 16 | Very High (malnutrition risk) |
| Moderate Thinness | 16 – 17 | High |
| Mild Thinness | 17 – 18.5 | Moderate |
| Normal Weight | 18.5 – 25 | Low (reference range) |
| Overweight | 25 – 30 | Increased |
| Obese Class I | 30 – 35 | High |
| Obese Class II | 35 – 40 | Very High |
| Obese Class III | > 40 | Extremely High |
BMI Table for Children and Teens (Ages 2–20)
The CDC uses percentile-based BMI-for-age standards that account for age and biological sex. A child's BMI changes substantially as they grow; the same numerical BMI value that indicates healthy weight at age 8 may indicate overweight at age 5. Percentile charts provide context that raw numbers cannot.
| Category | Percentile Range |
|---|---|
| Underweight | < 5th percentile |
| Healthy Weight | 5th – 84th percentile |
| At Risk of Overweight | 85th – 94th percentile |
| Overweight | ≥ 95th percentile |
BMI by Gender: Men vs Women
While the WHO applies the same BMI thresholds to both sexes, research consistently shows that men and women have fundamentally different body composition at any given BMI value. At a BMI of 25, women typically carry approximately 35–38% body fat, while men at the same BMI carry approximately 22–26% body fat. This difference exists because women naturally require more essential fat for hormonal and reproductive function.
| Category | Men (Body Fat %) | Women (Body Fat %) |
|---|---|---|
| Essential Fat | 2–5% | 10–13% |
| Athletic | 6–13% | 14–20% |
| Fitness | 14–17% | 21–24% |
| Acceptable | 18–24% | 25–31% |
| Obese | ≥ 25% | ≥ 32% |
This is why our calculator uses the Deurenberg formula — which factors in both age and biological sex — to provide a personalised estimated body fat percentage that is more clinically meaningful than the BMI number alone.
Ethnicity-Adjusted BMI Thresholds
The standard WHO BMI cut-off values were developed primarily from studies on European populations. Subsequent research — including a major 2004 WHO expert consultation — identified that East Asian and South Asian populations develop metabolic complications (type 2 diabetes, hypertension, cardiovascular disease) at lower BMI values than the standard thresholds suggest. This finding has significant implications for the estimated 2.3 billion people of Asian descent worldwide.
| Population Group | Overweight Threshold | Obese Threshold | Source |
|---|---|---|---|
| General / European (WHO standard) | ≥ 25.0 | ≥ 30.0 | WHO 2000 |
| East Asian (Chinese, Japanese, Korean) | ≥ 23.0 | ≥ 27.5 | WHO 2004 Consultation |
| South Asian (Indian, Pakistani, Bangladeshi) | ≥ 23.0 | ≥ 27.5 | WHO / ICMR guidelines |
| Pacific Islander | ≥ 26.0 | ≥ 32.0 | Regional research |
| Black / African American | ≥ 25.0* | ≥ 30.0 | AHA / CDC |
* Some research suggests Black populations may develop adiposity-related risk at slightly higher BMI values; however, standard WHO thresholds remain in clinical use. Discuss with your healthcare provider.
If you selected your ethnicity in the Advanced Metrics section above, this calculator automatically flags whether your result would be re-categorised under ethnicity-adjusted thresholds — a feature not available in most standard online BMI tools.
BMI for Special Populations
BMI was designed as a population-level screening tool and performs differently across several specific demographic groups. Understanding these nuances prevents misclassification.
Athletes & Bodybuilders
High muscle mass elevates BMI without increasing health risk. An NFL lineman or competitive powerlifter may register BMI 35–40 while carrying very low body fat. For athletes, DEXA scanning or skinfold caliper measurements are far more accurate assessments of adiposity. Our WHtR metric provides a better screen for this group than BMI alone.
Elderly Adults (65+)
Research suggests that BMI 25–27 may actually be associated with lower mortality in adults over 65 — slightly above the standard 'normal' range. Muscle mass naturally declines with age (sarcopenia), so an older adult with 'normal' BMI may have a higher body fat percentage than the number implies. Height also decreases with age, which can artificially inflate BMI.
Pregnant Women
BMI is not a valid measurement during pregnancy. Pre-pregnancy BMI is used by healthcare providers to determine appropriate gestational weight gain guidelines (based on IOM recommendations). The calculator should not be used to assess health during pregnancy — this requires specialised obstetric care.
Children & Adolescents
CDC percentile-based BMI-for-age charts are the standard for anyone under 20 years old. The same BMI value can mean healthy weight at one age and overweight at another due to normal growth patterns. Paediatricians track percentile trends across multiple visits rather than single measurements.
People with Physical Disabilities
Individuals using wheelchairs or with limb differences present significant BMI calculation challenges. Limb-weight correction factors exist for amputees (e.g. lower leg = ~6% of body weight). Height measurement is problematic for non-ambulatory individuals. Specialised assessment protocols developed for spinal cord injury populations should be used.
US Military Standards
All US military branches screen using weight-for-height tables aligned to BMI, with maximum BMI values ranging from 26–28 depending on age and sex. If a service member exceeds the BMI threshold, a circumference-based body fat measurement is administered. Army Regulation 600-9 specifies body fat limits of 20% (men) and 30% (women).
BMI and Weight Loss Medications: GLP-1 Eligibility Thresholds
A significant development in obesity medicine since 2021 has been the FDA approval of GLP-1 receptor agonists for chronic weight management. These medications — including semaglutide (Wegovy) and tirzepatide (Zepbound) — have direct BMI-based eligibility criteria that have made BMI awareness more clinically relevant than ever before.
| Medication | FDA Approval | BMI Eligibility | With Comorbidity |
|---|---|---|---|
| Semaglutide (Wegovy) | 2021 | BMI ≥ 30 | BMI ≥ 27 + hypertension, T2D, or dyslipidemia |
| Tirzepatide (Zepbound) | 2023 | BMI ≥ 30 | BMI ≥ 27 + at least one weight-related condition |
| Liraglutide (Saxenda) | 2014 | BMI ≥ 30 | BMI ≥ 27 + weight-related comorbidity |
| Naltrexone/Bupropion (Contrave) | 2014 | BMI ≥ 30 | BMI ≥ 27 + weight-related comorbidity |
The "comorbidity pathway" is significant: a person with BMI 27–29.9 who also has high blood pressure, type 2 diabetes, or high cholesterol qualifies for prescription weight-loss medications under FDA guidelines. This has made accurate BMI calculation — and awareness of the specific 27 and 30 thresholds — critical information for millions of people evaluating treatment options with their physicians.
Medical Disclaimer: BMI eligibility thresholds are one component of a broader clinical assessment. Prescription decisions are made by licensed healthcare providers. This information is for educational purposes only and does not constitute medical advice.
BMI Thresholds for Bariatric Surgery
Bariatric surgical procedures — including Roux-en-Y gastric bypass, sleeve gastrectomy, and adjustable gastric banding — are evaluated against NIH Consensus Guidelines that have been in use since 1991 and updated by the American Society for Metabolic and Bariatric Surgery (ASMBS). BMI is the primary screening threshold.
BMI ≥ 40
Standard Candidacy
Eligible for all bariatric procedures without requiring additional comorbidities.
BMI 35–39.9
Eligible with Comorbidities
Eligible if at least one obesity-related condition is present (T2D, hypertension, sleep apnea, joint disease).
BMI 30–34.9
Emerging Criteria
Some insurance policies and international guidelines now support procedures for metabolic syndrome in this range, particularly sleeve gastrectomy.
Risks Associated with Being Overweight
A higher BMI correlates with increased health risks across multiple physiological systems. The CDC and WHO document connections between elevated BMI and the following chronic conditions. While BMI alone does not diagnose disease, it serves as a useful screening indicator.
- •Elevated blood pressure and cardiovascular strain
- •Type 2 diabetes and impaired glucose regulation
- •Heart disease, stroke, and atherosclerosis progression
- •Non-alcoholic fatty liver disease (NAFLD)
- •Joint deterioration (osteoarthritis) and reduced mobility
- •Sleep apnoea and breathing difficulties
- •Increased risk of certain cancers (endometrial, breast, colon)
- •Reduced quality of life and mental health considerations
- •Gastroesophageal reflux disease (GERD)
Risks Associated with Being Underweight
Low BMI may indicate nutritional insufficiency or underlying health concerns. Being significantly underweight can compromise multiple body systems.
- •Nutritional deficiencies including iron, vitamin B12, and folate
- •Weakened bone density and increased fracture risk (osteoporosis)
- •Hormonal imbalances and reproductive health concerns
- •Compromised immune system function and increased infection susceptibility
- •Increased surgical and anaesthetic risk
- •Muscle wasting (sarcopenia) and reduced physical strength
Limitations of BMI
BMI does not differentiate between muscle mass, bone density, and fat distribution. An athlete with significant muscle development may show a high BMI despite low body fat. Genetic factors, age-related changes, and individual metabolic variations all affect how BMI relates to actual health status. The Ponderal Index, Waist-to-Height Ratio, and estimated body fat percentage — all calculated by this tool — together provide a more complete assessment than BMI alone.
BMI Prime
BMI Prime expresses BMI as a ratio against the upper boundary of normal weight (25 kg/m²). A value of 1.0 means BMI is exactly at the upper normal limit. This normalised metric simplifies cross-population comparisons and progress tracking — particularly useful for people monitoring gradual changes over time where the raw BMI number may change slowly.
| Classification | BMI Range | BMI Prime |
|---|---|---|
| Severe Thinness | < 16 | < 0.64 |
| Moderate Thinness | 16 – 17 | 0.64 – 0.68 |
| Mild Thinness | 17 – 18.5 | 0.68 – 0.74 |
| Normal Weight | 18.5 – 25 | 0.74 – 1.00 |
| Overweight | 25 – 30 | 1.00 – 1.20 |
| Obese Class I | 30 – 35 | 1.20 – 1.40 |
| Obese Class II | 35 – 40 | 1.40 – 1.60 |
| Obese Class III | > 40 | > 1.60 |
Path to Improved Health
Improving your health extends well beyond any single metric. Long-term wellbeing depends on consistent physical activity, thoughtful nutrition, and developing sustainable habits.
Exercise Regularly
The WHO recommends 150–300 minutes of moderate aerobic activity weekly for adults, plus muscle-strengthening activities on 2 or more days per week. Regular physical activity strengthens your cardiovascular system, preserves muscle tissue, and enhances metabolic function independently of weight loss.

Eat Healthy Food
A balanced diet incorporating vegetables, fruits, whole grains, lean proteins, and healthy fats provides essential nutrients for optimal function. The Mediterranean and DASH dietary patterns have the strongest evidence base for cardiovascular health outcomes. Mindful portion awareness and choosing nutrient-dense foods over heavily processed options maintains steady energy levels.

Avoid Overeating
Mindful eating practices help distinguish true hunger from stress or boredom triggers. Eating regular meals at consistent times stabilises blood sugar and reduces excessive consumption. The satiety signal takes approximately 20 minutes to register — slower eating allows the body to recognise fullness before overeating occurs.
Alternate Estimates of Weight-Related Health Risks
BMI captures only one dimension of health risk. Research increasingly shows that where fat is stored matters as much as total body fat — visceral (abdominal) fat carries distinct metabolic consequences compared to subcutaneous fat.
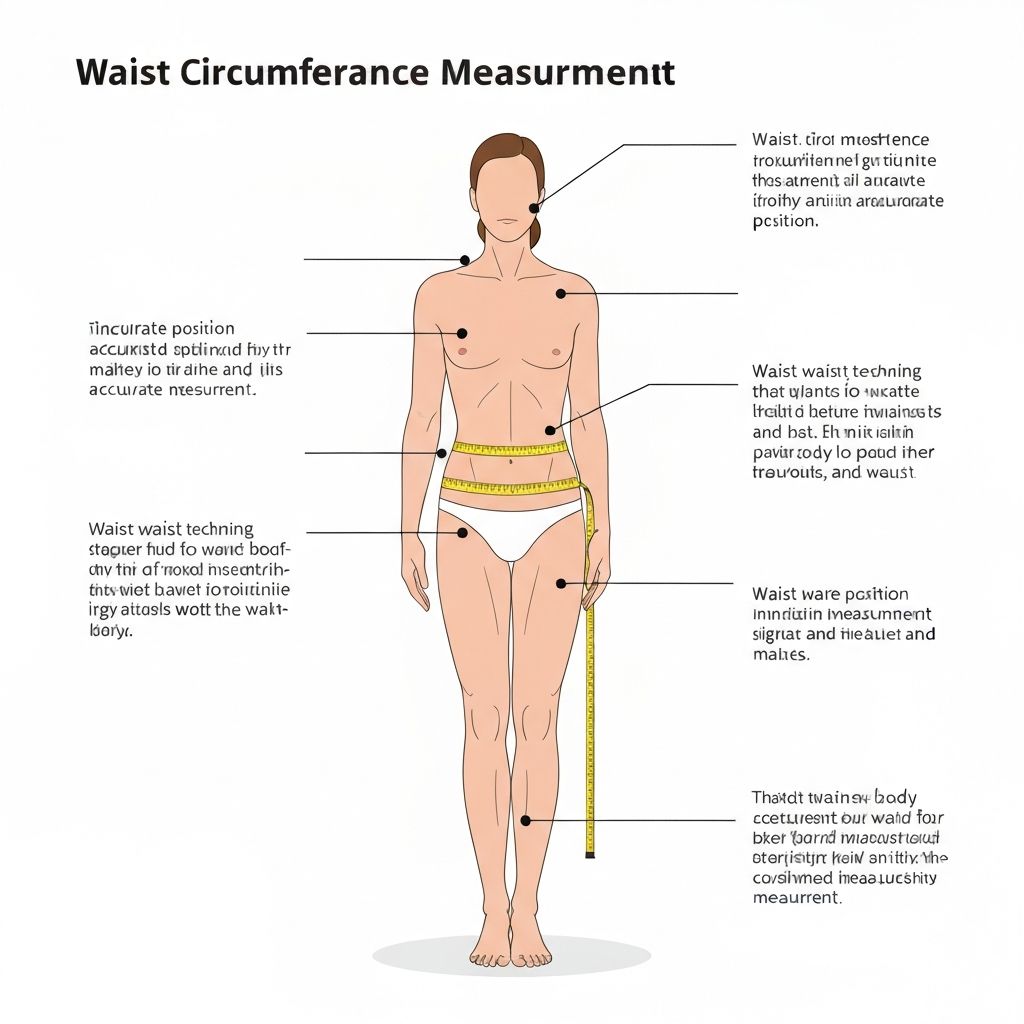
Waist Circumference
NIH guidelines define elevated cardiovascular risk at waist circumference greater than 102 cm (40 inches) in men and 88 cm (35 inches) in women. Abdominal fat correlates with visceral fat accumulation around organs — a stronger predictor of metabolic syndrome, insulin resistance, and cardiovascular disease than total body fat.
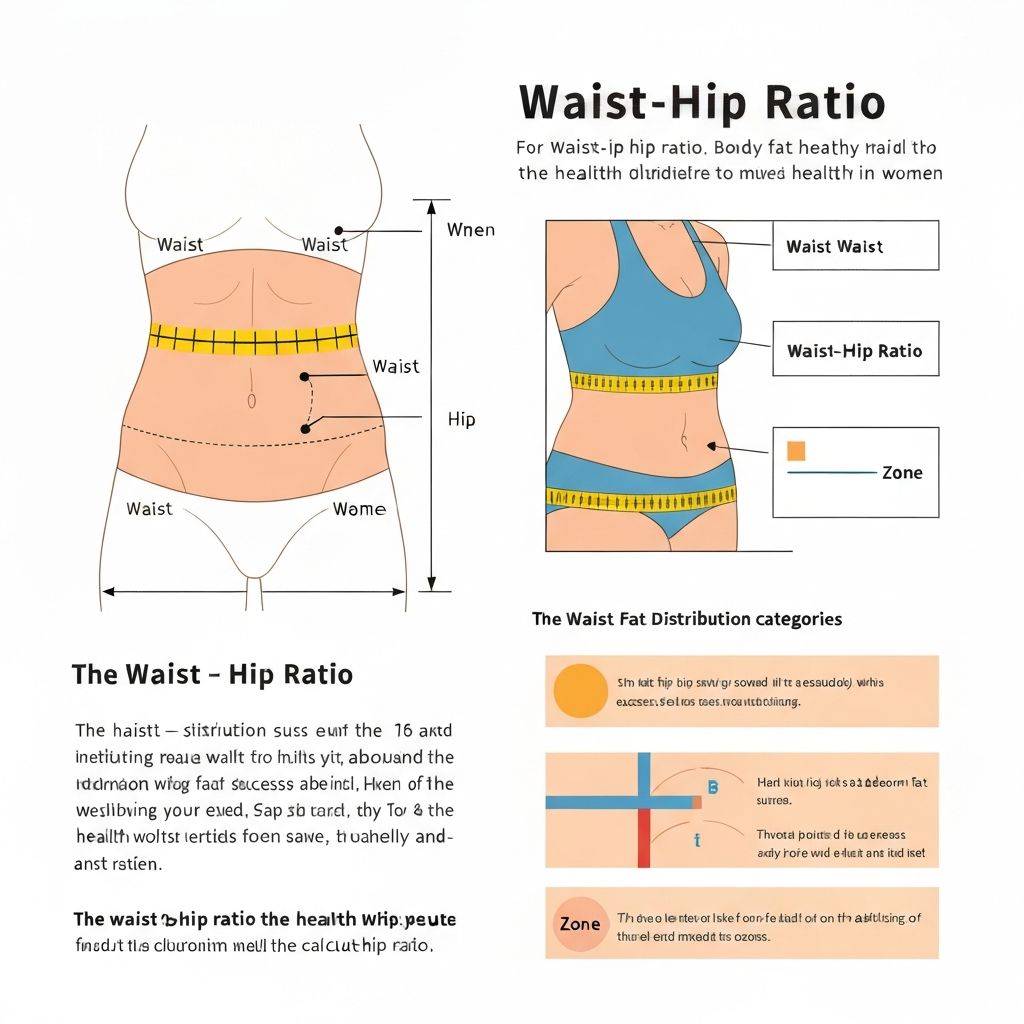
Waist-to-Hip Ratio
WHO thresholds for waist-to-hip ratio are 0.90 for men and 0.85 for women. A ratio above these values (apple-shaped distribution) correlates with higher cardiovascular and metabolic risk than fat concentrated in the hips and thighs (pear-shaped distribution).
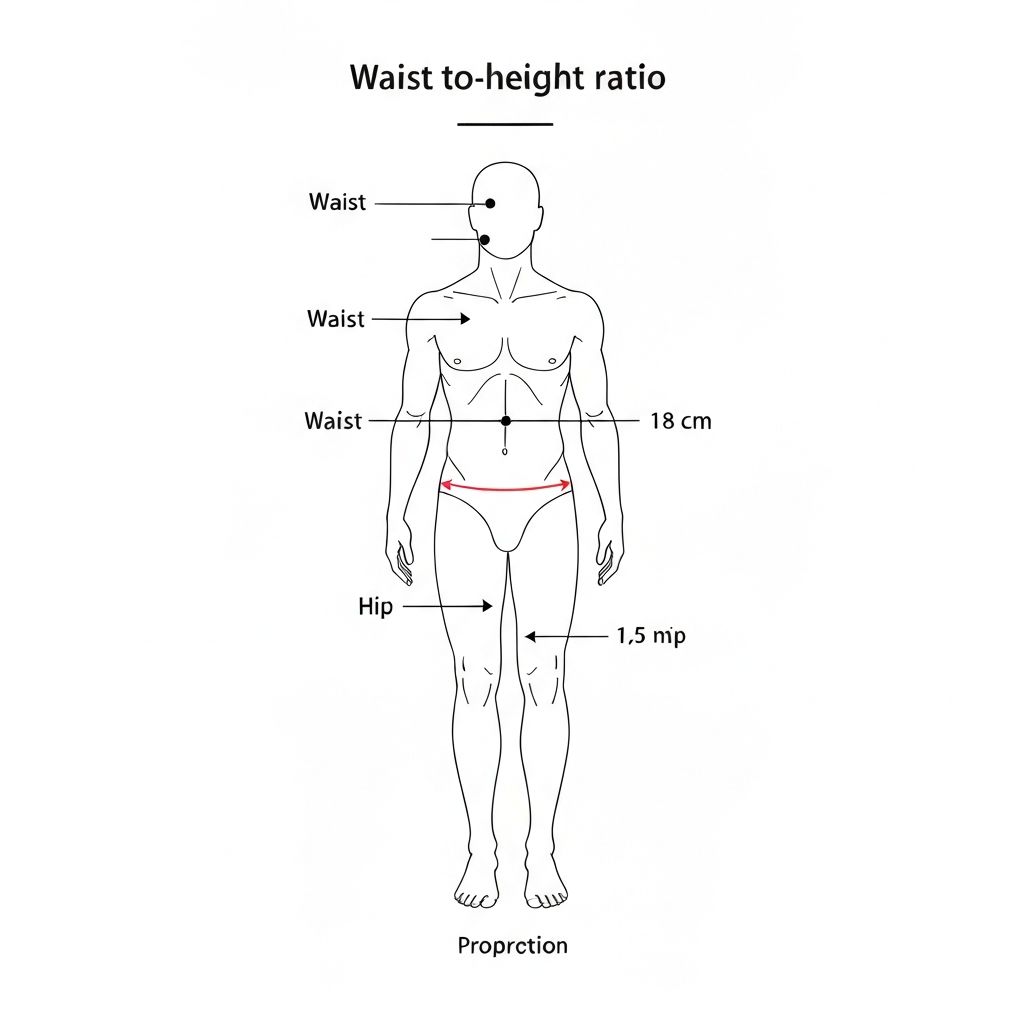
Waist-to-Height Ratio
A WHtR below 0.5 across all adult age groups is associated with reduced cardiometabolic risk. A 2012 meta-analysis of over 300,000 subjects found WHtR to be a stronger predictor of cardiovascular events, type 2 diabetes, and hypertension than BMI alone. The simple rule of thumb: "keep your waist to less than half your height."
BMI Calculation Formula
Metric:
BMI = weight (kg) ÷ height² (m²)
Imperial:
BMI = [weight (lbs) ÷ height² (in²)] × 703
BMI Prime:
BMI Prime = BMI ÷ 25
Body Fat % (Deurenberg, 1991):
BF% = (1.20 × BMI) + (0.23 × Age) − (10.8 × Sex) − 5.4
Where Sex = 1 (male) or 0 (female)
Frequently Asked Questions About BMI
Important Medical Note
BMI is a population-level screening tool, not a diagnostic instrument. It may overestimate body fat in muscular individuals and underestimate it in those with low muscle mass. It does not account for fat distribution, which is independently linked to health risk. Always consult a qualified healthcare provider for personalised health assessment, particularly before making significant changes to diet, exercise, or medical treatment.
Trust & Transparency
Content Accuracy:
All BMI thresholds reference WHO (2000, 2004) and CDC guidelines. Body fat formula: Deurenberg et al. (1991), IJDO. Bariatric criteria: NIH Consensus (1991), updated ASMBS guidelines. GLP-1 eligibility: FDA prescribing information (2021–2023).
Formulas Used:
BMI (Quetelet Index), BMI Prime, Ponderal Index (Rohrer's Index), Body Surface Area (Mosteller 1987), Waist-to-Height Ratio, Deurenberg Body Fat % formula
Purpose & Limitations:
Educational and informational use only. Not intended for medical diagnosis. Less accurate for athletes, elderly, pregnant women, and children.
Privacy:
All calculations run locally in your browser. No health data is collected, stored on servers, or transmitted. History is stored only in your browser's local storage and never leaves your device.